International Journal for Biosocial Research, 1986, 8(2); 185-195.
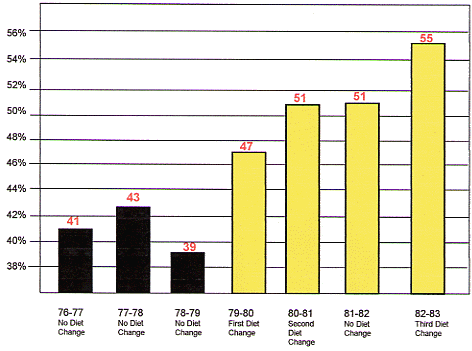
Over 4 years, 803 New York City schools changed their breakfast and lunch programs. They lowered sucrose, synthetic food color/flavors, and two preservatives (BHA and BHT). For each change, there was an improvement (and no improvement for the year without any change) until they had increased 15.7% in mean academic percentile ranking above the rest of the nation’s schools who used the same standardized tests.
Table 1: National Rankings of 803 New York City Public Schools Before and After Diet Changes
Prior beginning this change, the standard deviation of the annual change in national percentile ratings had been less than 1% — except for the year 1977-78 in which they tried lowering fat levels which also removed many processed foods from their menu.
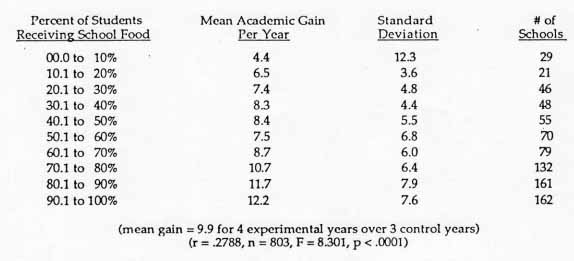
Before this change, the more students in a school who ate the school breakfast and lunch, the worse that school’s scores; after the changes, the more students who ate at school, the better that school’s scores.
It should be remembered that the above chart is an average of over a MILLION children. This is a very big study. Not all the children improved in the same way; in fact, before the diet change, 12.4% of the students were 2 or more years behind their grade level, but by the end of the study, only 4.9% of students were 2 years below grade level.
Table 3: Mean Gain in School Achievement Rank and Percent of Student Involvement for Four Years After Diet Revisions.


